

| HOME |
|
MONITORING |
|
Middle-term
|
| ARTICLE |
| LINKS |
| CONTACT |
|
RUS ENG |
Middle-term cosmic ray monitoring
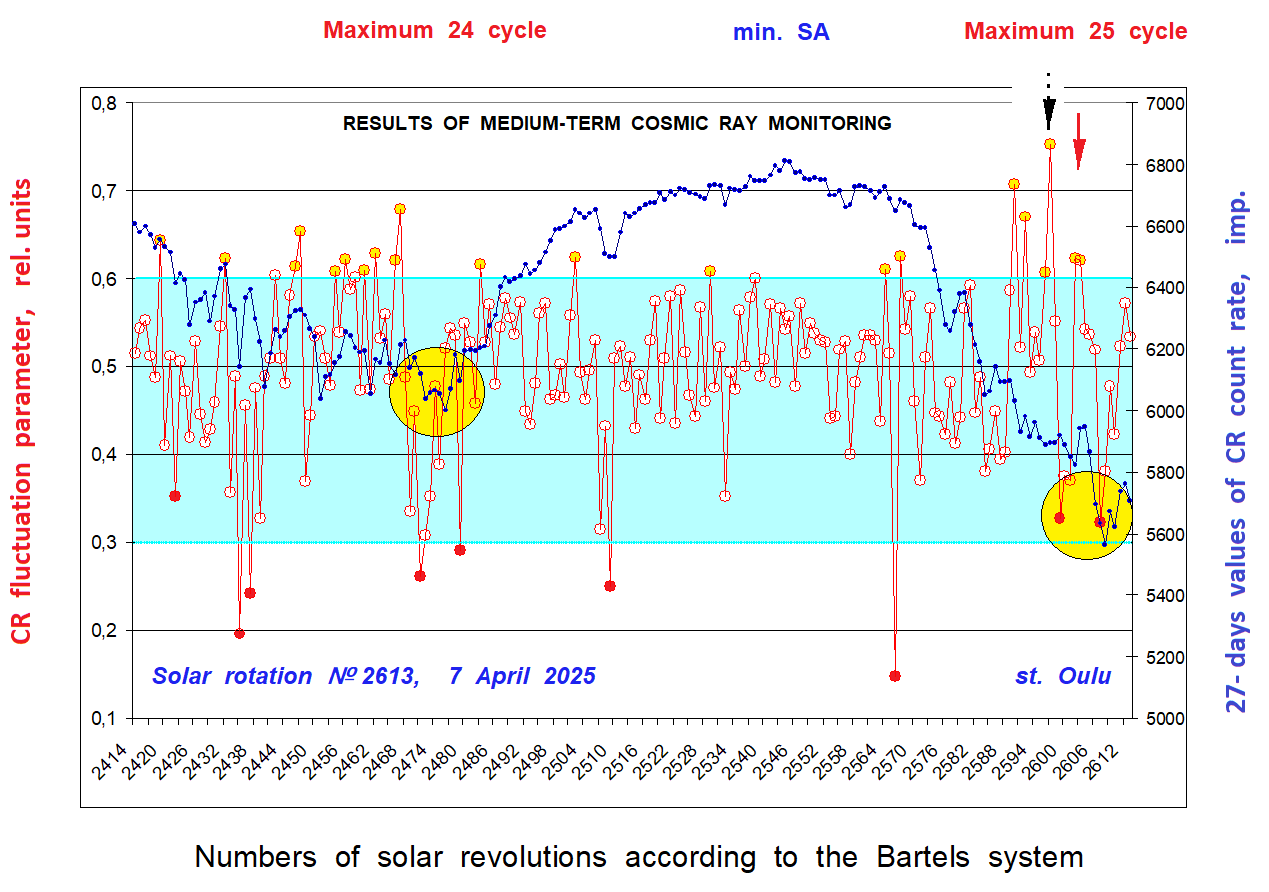 |
| Cosmic ray count rate at Oulu station (Finland) in pulses per 5 minutes, averaged over 7776 points of 5-min values during each solar rotation - blue dotted curve, scale on the right for the time interval starting from the 2409-2608 rotation. 27-day values of the CR fluctuation parameter in relative units - solid red curve, scale on the left. 90% significance level is shown. CR fluctuation parameter values exceeding the "cosmic noise" region (shown in green) are harbingers of increased solar activity. The precursor of the beginning of the maximum of the 25th cycle - the one on the far right (shown by the vertical arrow - dotted red line) is registered on the rotation № 2597. The subsequent "double" precursor is registered on rotations № 2602- 2603 in May-June 2024. On the contrary, a fairly low - diagnostic value of the CR fluctuation parameter (the penultimate point in red, revolution № 2599, March 2024, as well as on the last two revolutions 2607-2608), is defined as - a marker of the MAXIMUM of the new 25th cycle. |